I recently took some time to develop a photo frame style home automation control panel. The idea is to control some common tasks of my home assistant setup from a panel instead of having to rely on the phone. To hide the panel, it currently act as a photo frame until touched.
The build is based on a Raspberry Pi 2 with the official touch screen attached and a USB wifi dongle. Nothing fancy, but still good enough.
One of the features that I wanted was a weather forecast, so I decided to use Yr’s xml weather as a base for this. The result is the YrWeatherModel QML item.
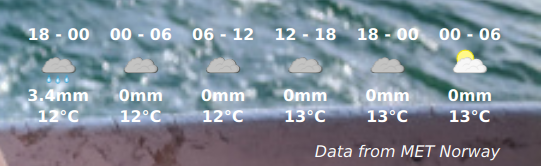
The presentation side of things is the fairly straight forward piece of QML shown below, resulting in the overlay shown above.
Row {
    anchors.bottom: dateText.bottom
    anchors.right: parent.right
    anchors.rightMargin: 40

    spacing: 20
    Repeater {
        delegate: Column {
            spacing: 2
            Text {
                anchors.horizontalCenter: parent.horizontalCenter
                color: "white"
                font.pixelSize: 16
                font.bold: true
                text: {
                    switch (period) {
                    case 0:
                        "00 - 06"
                        break;
                    case 1:
                        "06 - 12"
                        break;
                    case 2:
                        "12 - 18"
                        break;
                    case 3:
                    default:
                        "18 - 00"
                        break;
                    }
                }
            }
            Image {
                anchors.horizontalCenter: parent.horizontalCenter
                source: symbolSource
            }
            Text {
                anchors.horizontalCenter: parent.horizontalCenter
                color: "white"
                font.pixelSize: 16
                font.bold: true
                text: precipitation + "mm"
            }
            Text {
                anchors.horizontalCenter: parent.horizontalCenter
                color: "white"
                font.pixelSize: 16
                font.bold: true
                text: temperature + "°C"
            }
        }

        model: weatherModel.model
    }
}
This is followed by the model itself, and a small notice of the data source.
YrWeatherModel {
    id: weatherModel
    place: "Sweden/V%C3%A4stra_G%C3%B6taland/Alings%C3%A5s"
}

Text {
    anchors.bottom: parent.bottom
    anchors.right: parent.right
    anchors.bottomMargin: 5
    anchors.rightMargin: 40
    text: weatherModel.dataSourceNotice
    color: "white"
    font.pixelSize: 16
    font.italic: true
}
Diving into the model itself, we hit the interesting parts. The structure looks like this:
Item {
    id: root

    property alias model: weatherModel
    property int refreshHour: 1     // How often is the model refreshed (in hours)
    property int dataPoints: 6      // How many data points (max) are expected (in 6h periods)
    property string place           // Place, URL encoded and according to Yr web site, e.g. Sweden/V%C3%A4stra_G%C3%B6taland/Alings%C3%A5s
    readonly property string dataSourceNotice: "Data from MET Norway"

    ListModel {
        id: weatherModel
    }

    Timer {
        interval: 3600000 * root.refreshHour
        running: true
        repeat: true
        onTriggered: {
            _innerModel.reload();
        }
    }

    XmlListModel {
        id: _innerModel

        query: "/weatherdata/forecast/tabular/time"

        source: (place.length === 0)?"":("https://www.yr.no/place/" + root.place + "/forecast.xml")

        XmlRole { name: "period"; query: "string(@period)" }
        XmlRole { name: "symbol"; query: "symbol/string(@number)"; }
        XmlRole { name: "temperature"; query: "temperature/string(@value)"; }
        XmlRole { name: "precipitation"; query: "precipitation/string(@value)"; }

        onStatusChanged: {
            // ...
        }
    }
}
As you can see, the model consists of an inner model of the type XmlListModel. This model is refreshed by a timer (don’t refresh too often – you will most likely be auto-banned by Yr). At the top, there is also a ListModel that is the actual model used by the user interface.
The reason for the ListModel to exist is that I wanted to be able to limit how many data points I show. Each data point represents a six hour window, and I’d like 6 of them, i.e. one and a half day of forecasting.
The onStatusChanged handler in the XmlListModel takes care of this in the following for loop:
onStatusChanged: {
    if (status === XmlListModel.Ready)
    {
        for(var i = 0; i< root.dataPoints && i < count; ++i)
        {
            var symbol = get(i).symbol;
            var period = parseInt(get(i).period);
            var is_night = 0;

            if (period === 3 || period === 0)
                is_night = 1;

            weatherModel.set(i, {
               "period":period,
               "symbol":symbol,
               "symbolSource":"https://api.met.no/weatherapi/weathericon/1.1/?symbol=" + symbol + "&is_night=" + is_night + "&content_type=image/png",
                "temperature":get(i).temperature,
                "precipitation":get(i).precipitation
                });
        }
    }
    else if (status === XmlListModel.Error)
    {
        console.warn("Weather error")
        console.warn(errorString());
    }
}
As you can tell, this code has *very* limited error handling. It is almost as it has been designed to break, but it works. The code also shows how convenient it is to connect to online services via QML to build simple, reusable, models that can be turned into beautiful user interfaces.
Next time I have some free time, I’ll look at interfacing with the public transport APIs. Then I will have to deal with JSON data and make explicit XmlHttpRequest calls.
Sounds cool! Have you already seen https://conf.kde.org/en/Akademy2018/public/events/72 ? – i made a smart mirror with QML, that also has home assistant and public transportation integrations – but used Python as backend data source
This was new to me. It looks really cool! Thanks for sharing.