I just found myself in the situation where i need to be able to create bargraphs.
The design is fairly limited: a row of stacked bars with optional labels under and inside each bar.
I also want to be able to color the bars.
I wrote a quick little PyQt-based Python program. It lets you write things like this:
bs = BarGraphStack()
bg = BarGraph()
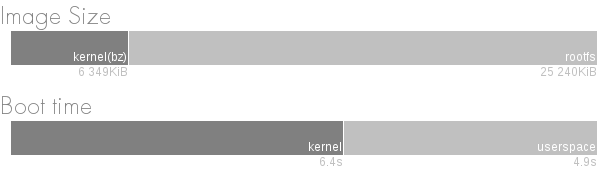
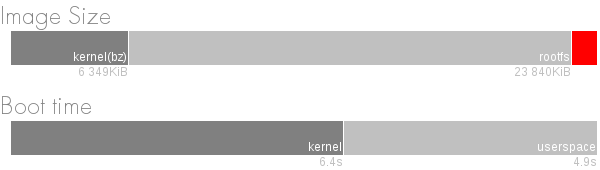
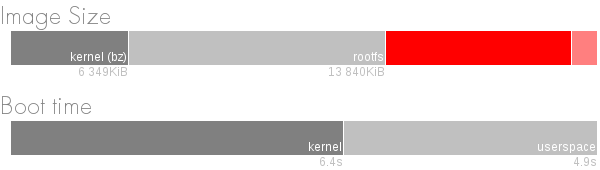
bg.setTitle("Image Size")
bg.addBar(Bar(6349, Qt.Qt.darkGray, "6 349KiB", "kernel(bz)"))
bg.addBar(Bar(25240, Qt.Qt.lightGray, "25 240KiB", "rootfs"))
bs.addBarGraph(bg)
i = bs.render();
# i is a QImage
You can get the latest source code from the Grapher github repository. It is probably obvious that this is Python code written by a C++ guy, but I hope that it still might be useful.
Now I need to add some steps to feed it data automatically, but that is for another day.